Important KPIs to Monitor
with SalezShark CRM Dashboard
The common question that arises in users’ minds is what exactly should we measure to improve our customer relationships? How often should we analyze, measure, and update the data? Let’s dig our CRM Dashboard a bit more. The SalezShark CRM Dashboard helps you to monitor essential sales and marketing KPIs as listed below. The perfect KPIs are always actionable, transparent, accessible, and easy to interpret.
Leads
- Number of leads generated every month
- The volume of lead sources: sales team-generated leads, referral leads, leads from the website, leads from social media

Sales Opportunities
- Number of sales opportunities winning every month
- Value of opportunities
- Total opportunities per phase
- Value of opportunities per phase
- Estimated close deals dates and value
- Source of opportunities

Sales & Account Team Activities
- Face-to-face new business meetings happening every month
- Number of sales volume of telephone engaged talks per week
- Number of sales volume of telephone calls per week

CRM Dashboard Features
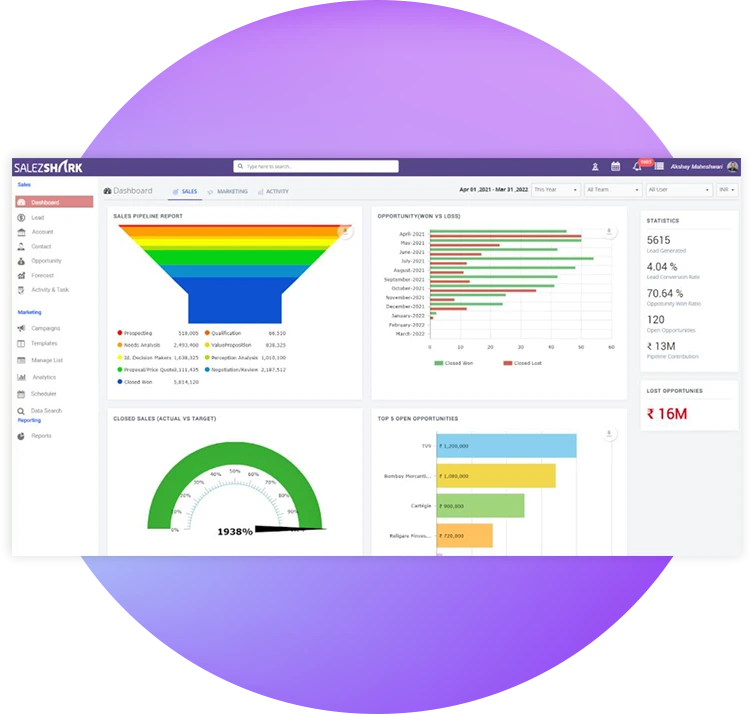
Dashboard CRM is used to view progress, goals, or tasks for each individual. It gives you a birds-eye view of sales performance for your team or even the whole organization. Dashboard sales software also identifies top prospects, manages the progress of sales deals, track sales activities, and forecast sales revenue.
- View
Opportunities - Revenue
Forecasting - Sales
Pipeline
Report - Customer
Analysis - Discovering
New Metrics
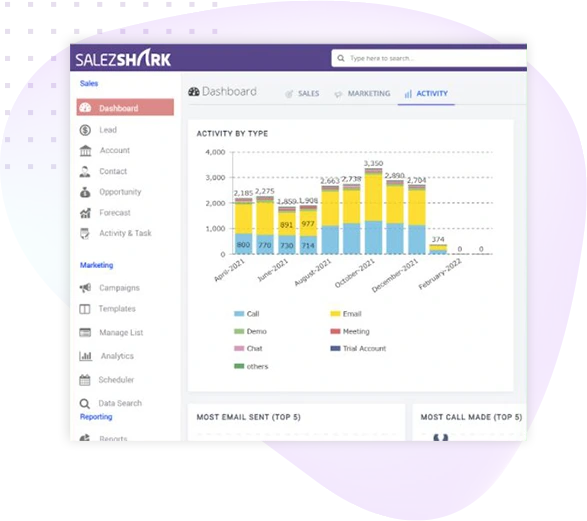
If you are working as a salesperson with a quota to meet, you can use the activity monitoring feature of CRM. The SalezShark CRM displays the total number of opportunities present for your platform. Not only this, but also it gives you the exact number of prospects you have contacted monthly, weekly, yearly as per your need.
CRM Dashboard reviews your to-do list to help your team to finish work before the deadline. The businesses having a longer sales cycle have prospects who often spend maximum time at every stage. This CRM Dashboard feature is beneficial since you never forget to follow up with your leads on time. In SalezShark CRM, you can keep track of activities of your choice in its visual dashboard.

Sometimes, it becomes cumbersome to calculate the total number of revenue opportunities and sales projections. The revenue forecasting option in CRM Dashboard eliminates the need to prepare complex reports to monitor your performance to meet quarterly, monthly or annual sales goals.

One of the major differences between viewing opportunities in a visual pipeline and the SalezShark CRM dashboard is the ability to view totals, trends as well as performance. In this CRM dashboard, you can take a whole of sales performance metrics that you want to view relevant to opportunities & deals.

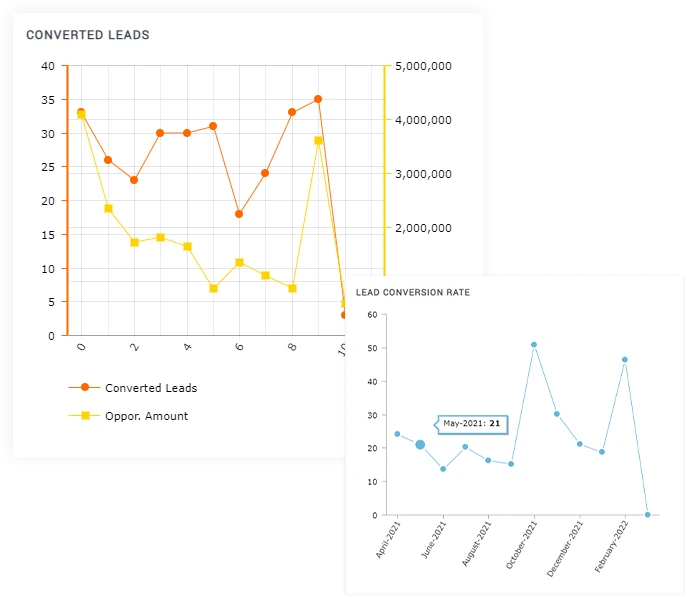
The Customer Analysis Report is the next section included on SalezShark’s custom CRM Dashboard. It shows the number of leads that turned into customers over a specific period of time. The real-world tracking feature makes it easy for you to spot the activities undergoing by every sales rep.

Coming down to the last but not least feature of CRM Dashboard that helps you to catch your target audience efficiently. It will store their Industry parameters as a part of the lead tracking process. This allows you to add a report to your CRM Dashboard that shows the most common Industries for leads to get converted into paying customers.
This enables you to run highly targeted advertising campaigns that can increase your lead conversion ratio. If your leads are never converting, it implies that you need to change your marketing approach or advertising strategy.

CRM Dashboard Visualization
In SalezShark CRM, you can recast your dashboard using information such as the position of deals in the sales cycle, new marketing qualified leads, toggle between different team members’ views, and leads originated by different sources.
This Dashboard has certain default views that can be customized to fit your small business needs. With SalezShark, you can filter your searches by the organization, user, month, deal size, revenue forecasts, and deals won.

Date Range
Every organization sets certain sales goals either monthly, quarterly, or annually. This Dashboard can filter activity and performance-based upon the standard or particular time duration. Since you can customize the date range as per your convenience, this feature increases flexibility for CRM users.

Reports
Dashboards have an in-depth reporting feature. SalezShark CRM allows you to view the below-mentioned points in this custom reporting-based system.
- Completed Activities
- Sent and received emails
- Deals initiated, in progress, won, and loss
- Revenue forecasting, and the value of deals won
Benefits of SalezShark CRM dashboard
These are some of the reasons a small business might want to use a CRM Dashboard
-
Keeps your team on the right track
An in-depth sales report might not always stay your team on the right pace to satisfy its goals. The top-level information presented by SalezShark dashboard helps your salespeople to get their tasks done by saving both time and effort that usually get consumed in analyzing detailed reports.
-
Streamlines sales tasks
Analyzing daily reports isn't only tedious but also consumes a lot of time. This CRM dashboard enables your team to quickly determine the priority of tasks that need to be finished without clicking through SalezShark CRM to fetch reports.
-
Real-time reporting
This CRM dashboard reacts to and reflects the necessary changes in CRM data instantly. This is how your sales employees succeed in building a full-proof strategy as per the recent KPI data instead of outdated numbers. Thus, this dashboard is highly powerful in guiding your sales team to accomplish your sales goals faster.


